Dashboard_for_Bombay_Hospital
🏥 Bombay Hospital Dashboard Analysis (Power BI Project)
📖 Project Overview
This project presents an interactive Hospital Performance Dashboard developed using Microsoft Power BI.
The objective of this analysis is to convert raw hospital operational data into meaningful insights that support better decision-making for hospital management.
The dashboard helps administrators monitor:
- Patient flow
- Department workload
- Doctor utilization
- Overall hospital performance
All insights are presented through a clear and easy-to-understand visual dashboard.
🎯 Business Objective
Hospitals handle large amounts of patient and operational data daily.
Without proper analysis, management cannot efficiently allocate staff, plan resources, or identify performance gaps.
This project answers key business questions:
- Which department receives the highest number of patients?
- What are peak admission periods?
- Which doctors handle the most cases?
- How is hospital workload distributed?
- How can management improve operational efficiency?
🛠 Tools & Technologies Used
- Power BI Desktop
- Power Query (Data Cleaning & Transformation)
- DAX (KPIs & Measures)
- Excel Dataset
📊 Dashboard Features
- Patient admission analysis
- Department-wise performance tracking
- Doctor workload distribution
- KPI indicators
- Interactive filters & slicers
- Dynamic visual reports
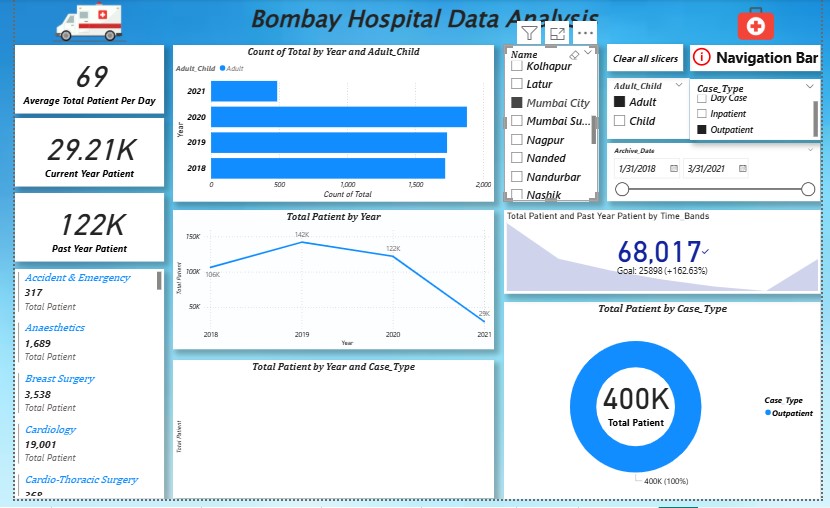
📷 Dashboard Preview
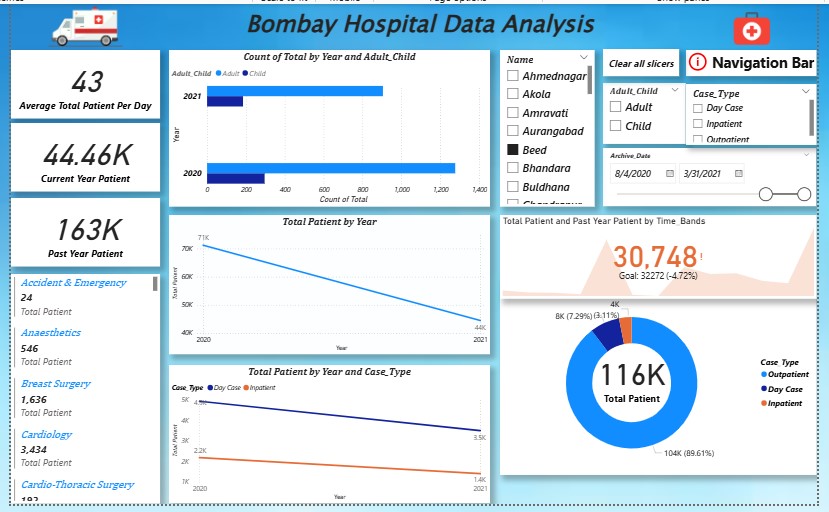
🏥 Full Dashboard
🏬 Department Analysis
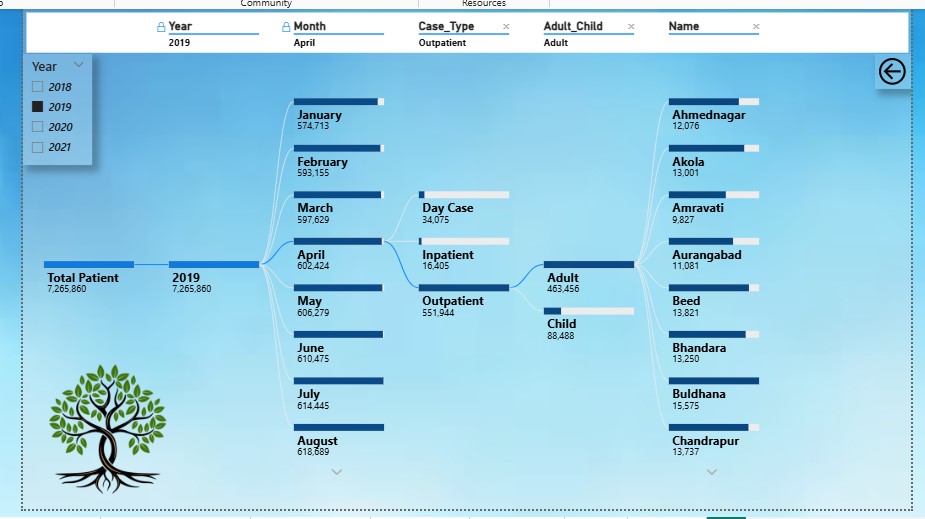
🌳 Patient Distribution (Tree Map)
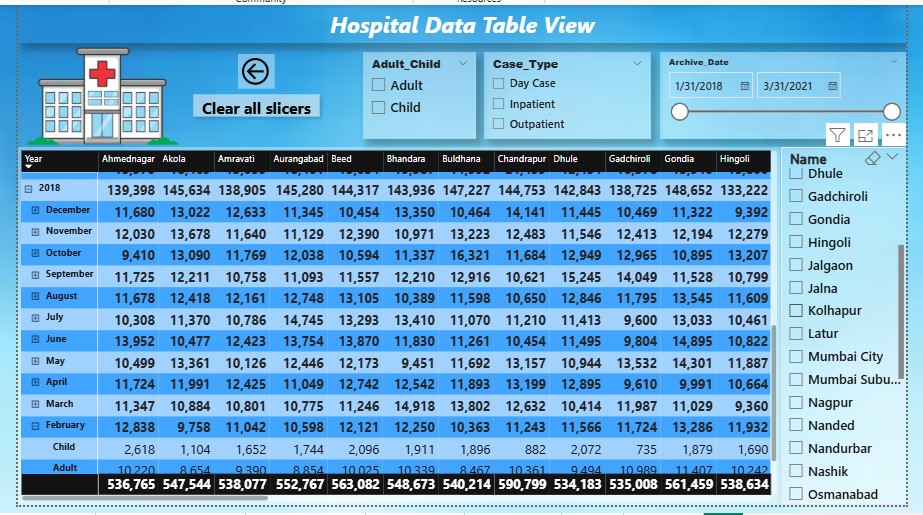
📋 Table View
🎛 Filters & Interactivity
📈 Key Insights
- Identified high-load hospital departments
- Recognized peak patient admission times
- Analyzed doctor case handling distribution
- Observed treatment demand patterns
- Supported better hospital resource planning
📂 Dataset Description
The dataset contains simulated hospital operational records including:
- Patient ID
- Department
- Doctor Name
- Admission Details
- Treatment Type
- Billing Data
Note:
This dataset is used strictly for educational and portfolio purposes.
🚀 How to Use
- Download the
.pbixfile from this repository - Open using Microsoft Power BI Desktop
- Interact with filters and visuals
- Explore hospital performance metrics
💡 Skills Demonstrated
- Data Cleaning
- Data Visualization
- Dashboard Design
- Business Insight Extraction
- KPI Creation using DAX
👨💻 Author
Rupesh Desai
Aspiring Data Analyst
| Skills: SQL | Power BI | Excel | Python | Data Analysis |
📧 Email: rupeshdesaiwork@gmail.com
🔗 LinkedIn: https://www.linkedin.com/in/rupeshdesai2010/